Pavlos Paraskevopoulos, Themis Palpanas. Where has this Tweet Come From? Fast and Fine-Grained Geolocalisation of Non-Geotagged Tweets. Social Network Analysis and Mining (SNAM) Journal 6(1), pp 1-16, 2016. .
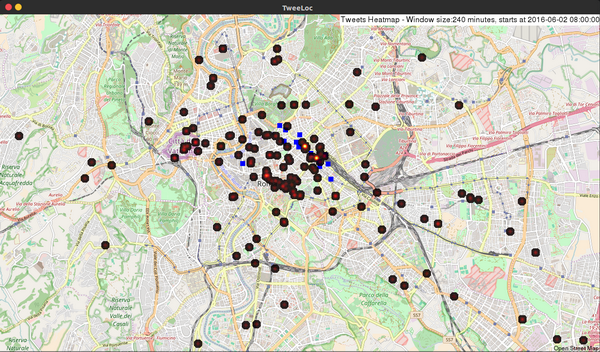
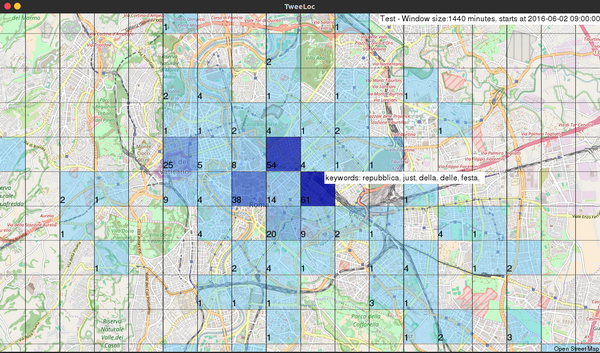
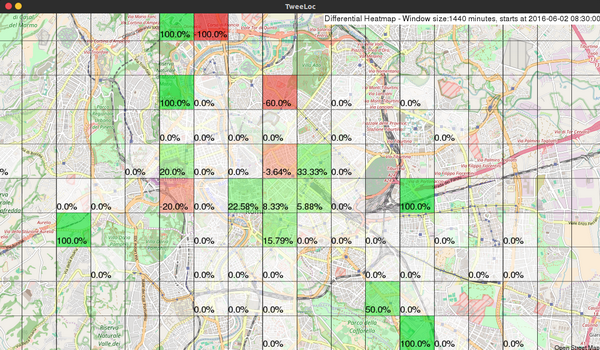
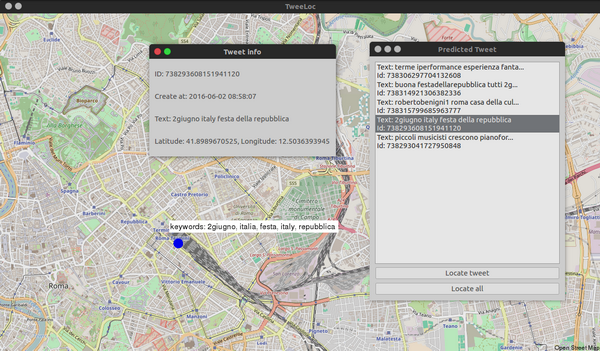
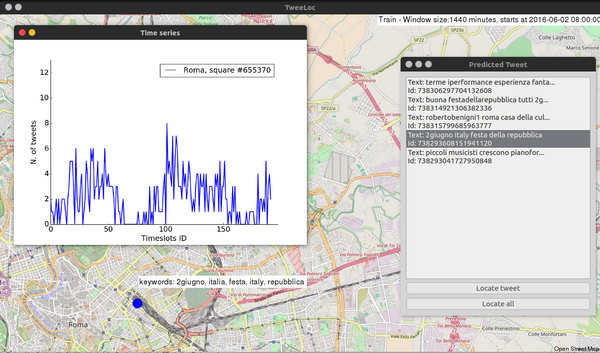
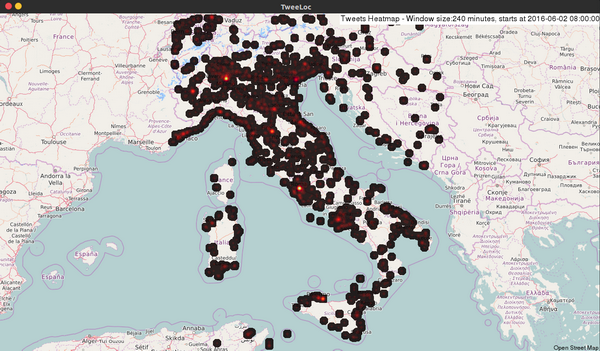
Pavlos Paraskevopoulos, Giovanni Pellegrini, Themis Palpanas. TweeLoc: A System for Geolocalizing Tweets at Fine-Grain. International Conference on Data Mining (ICDM), New Orleans, LA, USA, November 2017.